eSync historical data extraction in excel problem

Hello,
I have a problem with the data extraction in Excel.
The importing to Excel of 4 historical tags (floating) is no problem, the data is refreshing every minute.
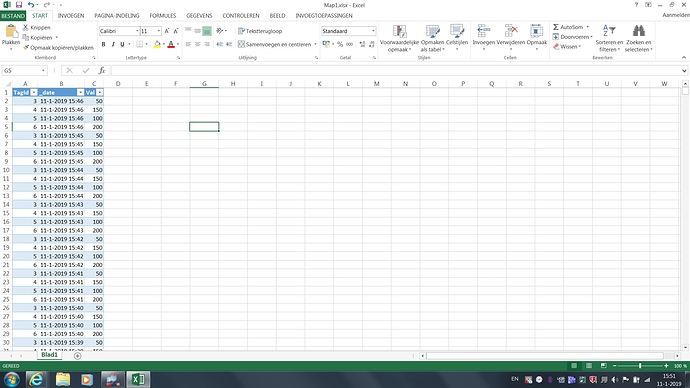
But problem is, al the data is extract to one row see image.
When I look in the eWon historical text the data is nice separated.
In eSync the data is separated but when it’s extract to excel it’s al together in one row.
Is there solution for this, i’am using excel 2013 and not a very experience guy with excel.
I want to upload a image but don’t now how.

Kind regards

Alex.

Hi Alex,

in excel you need highlight that one row and go to the Data tab> Text to Columns>Delimited>Semicolon>General>Finish

This should separate out your values

Oke thank you.
I gonna try it.

Hi Alex,

let me know if this works for you

Thanks,
Tim

Hello Tim,

no it’s not working, your solution is only working in rows not columns

In eSync the data is right, excel throws al the data in one column.

eSync1

I made the project in excel with new map/ data/ from other sources/ from Microsoft Query / Choose data source (esync database) and I use the Query Wizard.
I’m still looking for a solution, as I mention I’m not have much experience with excel.

kind regards,

Alex.

Hi Alex,

Can you send me the excel sheet and I’ll see if I can write a formula to put these in the right order?

-Tim

Hello Tim.

Here is the sheet

Map1.xlsx (329.7 KB)

Alex

Hey Alex,

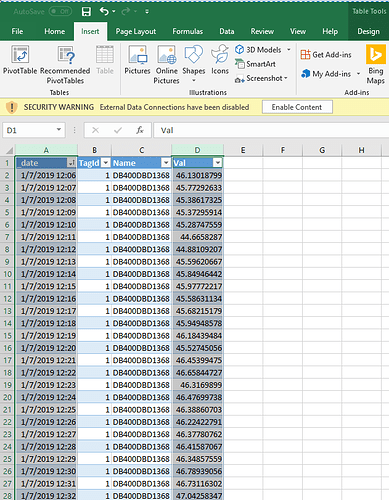
Can you be a little more specific about what you’re trying to do with the data? From what it looks like on the eSync data sheet you can only see one of the values for each tag. Are you trying to organize these into a time dependent graph for each of the tags?

Hello Tim,

The eSync data are 4 independent tags, the value you see is the last recorded.
When you open select tags history you see much more values.
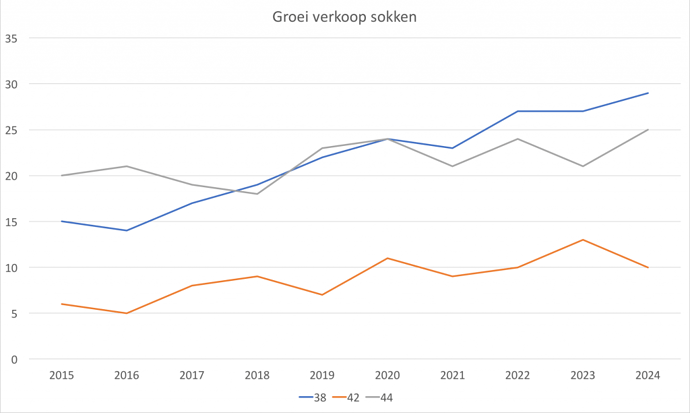
Yes i trying to organize these into a time dependented graph for each of the tags.
Something like the image.

When i import the data directly with Pluto it’s the way i want it, but Pluto is a heavy software package for these purpose.
Maybe there other options, but Excel must be enough for four lines.

KInd regards,

Alex.

Hi Alex,

I don’t have too much experience with excel, but you could do it this way until I find a better method of sorting the data.

Select which tag you’re working with

sendtoalex

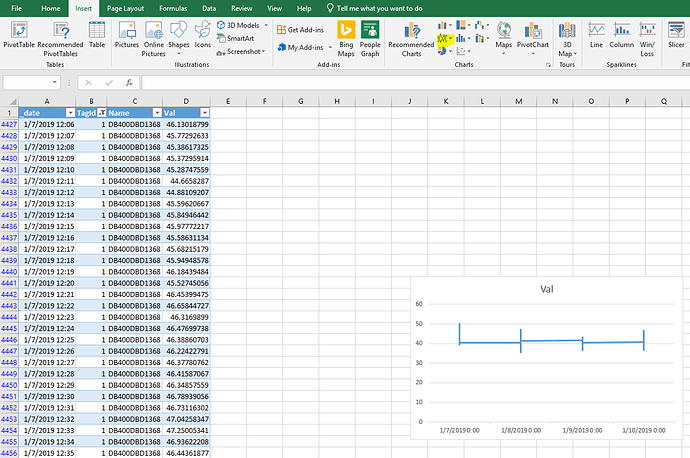
Select the full column values by clicking column A, then hold the ctrl key and select the D column.

After this go to insert and select the chart and you should be able to get the value of the that tag over time in a graph. I haven’t figured out how to sort it easily so that you can have multiple tags on the same graph yet though.

Hello Tim,

This method I was already using, but I was assuming there is a better way to work with.
Until there is a better way I will use it.

king regards,

Alex.