Memory Information

Hi Team,
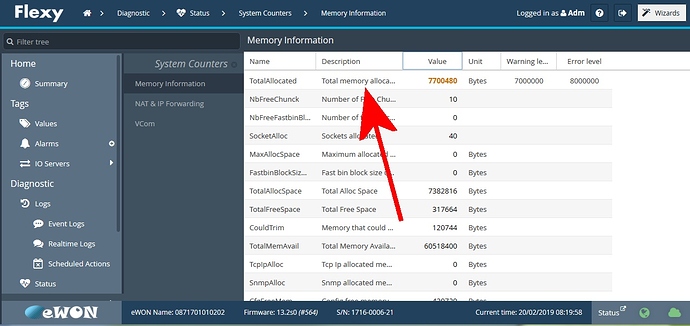
i need more info about the columns “Warning Level” and “Error Level” that is possible enable in the page Diagnostic->Status->System Counters->Memory Information

At the item “TotalAllocated” there are 7000kb for “warning level” and 8000kb for “error level”;

What happens if the warning level is reached?
and
What happens if the error level is reached?

Hello @iw3bti1,
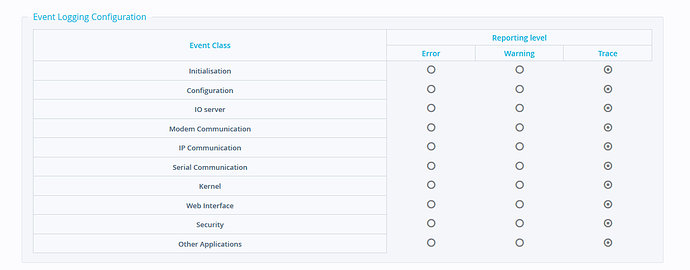
Are you referring to this? The reporting levels is to specify what error messages are written to the event log.

I am not sure what you are referring to in regards to the TotalAllocated I assume this is the level where you will start seeing error or warning messages in the event logs. Once you hit 7000kb you will see warning messages regarding the memory in the event logs then when you hit 8000kb you will receive error messages in the log.

Deryck

no I refer to this:

i have two colums WarningLevel and ErrorLevel;
now the value TotalAllocated is 7700480 but i have no warning in the event log;
what happens if the actual value is over the errorlevel value?

Was this question answered? What does happen when the ‘total memory allocated’ is higher than both the warning and error levels? And what causes this issue? Is it a symptom of another problem? We are currently seeing this in our logs.

If the device runs out of memory than the device will reboot. This is usually the result of one program using a large amount of memory. Are you running any Java programs or BASIC scripts or do you have a large number of tags on the device?

the limits in the two columns are wrong, in the new fw14.0pr the two columns are removed:

see releasenote.txt

CHANGED [ALL] GUI: Remove “warning level” and “error level” column from Status pages. Remove warning/error bounds for TotalAllocated field.

I’m new to ewon development so I’ll try to give you all the Information I know/have.

We are running both a Java program and a BASIC script.
The BASIC script is about 4 lines long and simply turns an LED value on and off.
When I run the Memory commands (“prog”, “var” and “tot”), I get back the following:
prog: 260731
var: 505484
tot: 766219

We also utilize about 200 Tags.

The realtime logs show the following Warnings and Errors:
[W] free memory low limit (786432 bytes) with 186 packlets in send queue reached -> removed 21% of low prio packlets (39)
[E] Failed to receive next frame (socket closed or uninitialized)

I’m unfamiliar with the Java program and I’m going to examine this next. In your opinion, what could be causing the error and warning shown above?

Kind regards.

From what you describe, it is most likely related to the tags and/or Java program, not the BASIC script. Have you tried lowering the update time of the tags to see if that makes a difference? Can you provide a backup of the device using eBuddy (include Support Files)?

Hi, thank you for the prompt response. I will follow your suggestions as soon as I can.
I do have a follow-up question regarding our Java code. It was written using J2ME and an old firmware version (not sure which). At some point, the firmware was updated to 13.2s1.
We want to move to the new (er) J2SE toolkit and the latest firmware (14.0s01??). Is this simply a matter of recompiling our code using Eclipse and uploading the jar file or is there more that we need to pay attention to?

Regarding our Tags - they are updated constantly (the ewon’s web interface shows this). We simply cannot get them to display in our visualisation tool.

For the newer toolkit, you should be able to just recompile and upload new jar, but I am not an expert when it comes to Java so I will check with a developer to see if there is anything else to look out for.

Is this a different issue? What is the visualization tool.

Topic closed due to inactivity.