Help for create a trend

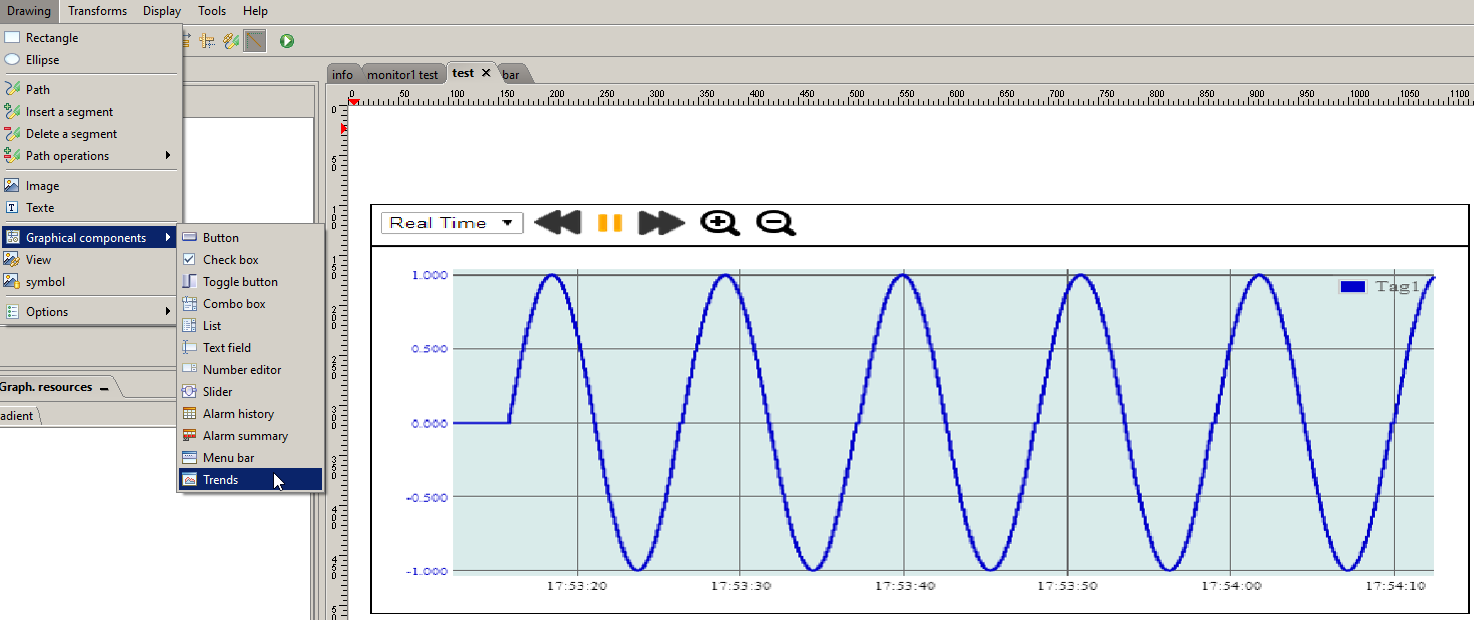
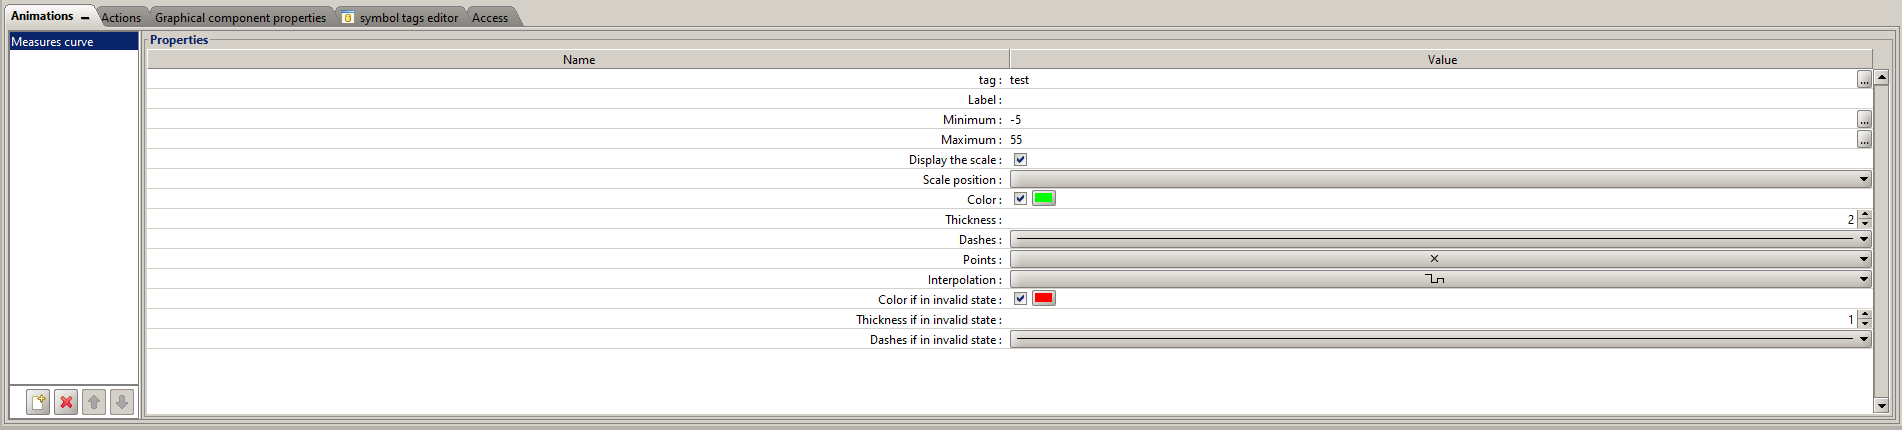
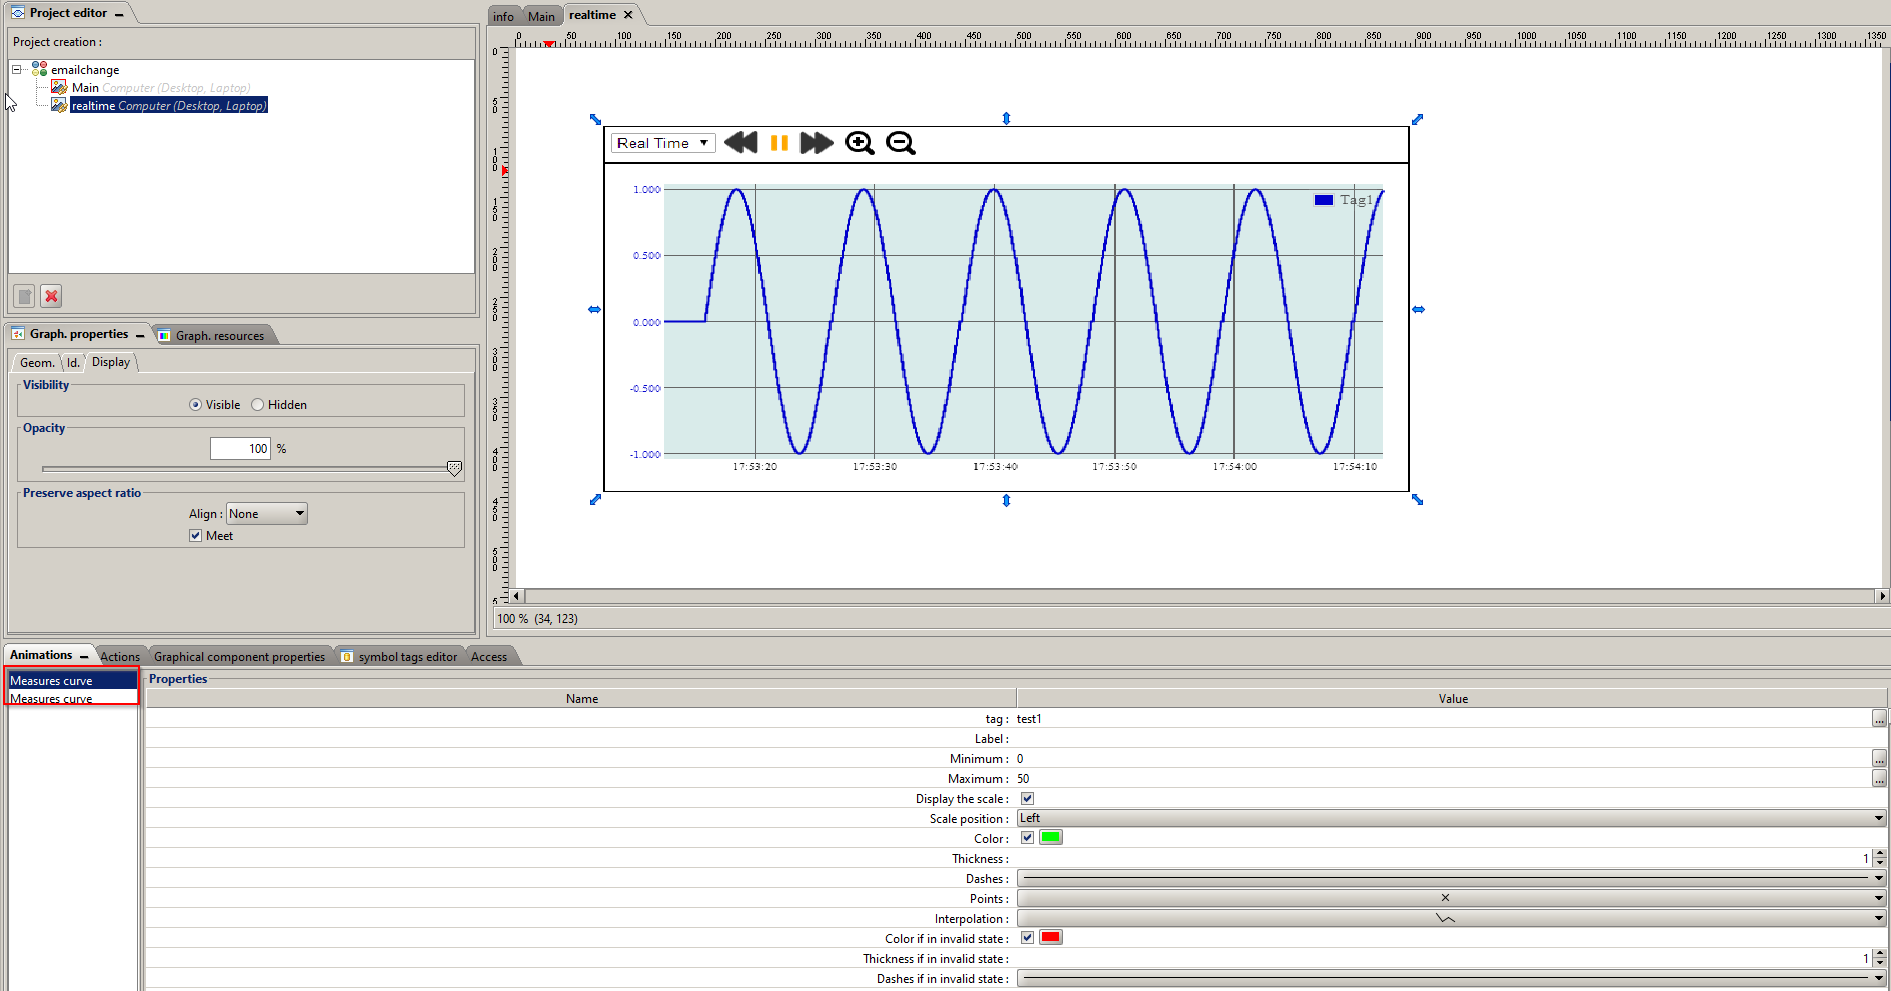
Hi, I have a problem for create a trend, if insere my tag in “mesure”

Once inser a tag in my trend, this trend is disappears but i delete the tag i can see the trend in simulation

Would say the flexy not communicate with this Viewon

Thanks you for you answer

Hi Remy,

Are these trends you’re looking at for Historical or Realtime graphs?

Thanks,
-Tim

hi thanks for you answer this problem is resolve internet explorer not support the trends

Hi Remy,

Thanks for writing back with the solution

Best Regards,
-Tim

Just last question i reach a guide for use a trend historical and realtime because im lost in the parameter of viewon (display and general)

Hi Remy,

You should be able to add the trend in ViewON here:

Then you should be able to add the measurement like it’s shown below:

Lastly you’ll need to setup your Graphical Component Properties
image

image

okey thanks !

You’re welcome! let me know if you have more questions

Hi tim !
I would like to do appear a graphical if the user to check the box it possible ?
thanks

hi tim !
I have a little question i would like to do appear a graphical if the box or button correspond is actived, it’s possible ?
Thanks you !

Hi Remy,

Tim is off until the 26th. Since you are in France, I would recommend you open a support case with the EU office by going to https://mysupport.hms.se

Happy Holidays,

Kyle

No problem i can wait ^^
thanks for you answer and happy holidays !

hello
I come back to you for my question I would like to be able to display graphs following the activation of box
thanks you

Hi Remy,

When you say you want to show a graph with the activation of a box, do you mean when you click a button on ViewON or when a value of a tag on the Flexy goes high?

Thanks,
-Tim

hi a click a button on Viewon

Would it work to make a button that just redirects you to a different page that contains this graph?

Hi tim,
thanks for you answer and scuse for my lat answer
hmmm not really
i need for exemple i have a one graphe with one trend “current” and second graph with one trend " voltage" if i want to compare i would like see the two trend in a one graphical.
I don’t want make a trend with all trend

I can’t explain well in English I hope you understand what I’m telling you /
Thanks you !

or is not possible i would like reveal a graph if i can check a box

Hi @alpha09,

I think I get what you’re saying. You can have it so that your graphs just show 2 tags. This can be done by doing a measure curve that will read your current and another measure curve on the same trend that reads voltage.

You can choose whether to display historical info or realtime info here:
image