Hi,
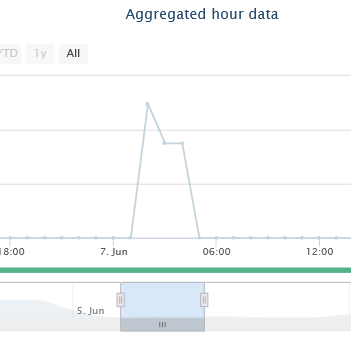
Using EC310 with Argos. I am delta logging a water meter in gallons every 5 minutes When I look at the historical logging for the week the chart automatically changes from fine-grained to “aggregated hourly data” which give an average gallons over the hour. It would much more meaningful in this case to show the totalized gallons over the hour. Is there a way to display totalized instead of aggregated?