
I have a ViewOn view with a trend component on it. On one computer the trend works just as expected. On another computer the runtime trend works fine but the historical trend never loads the data. Is there an extension or something that needs to be installed for the historical feature to work?

Hello @bboozer,
I don’t think there is an extension required but there could be an issue with the type of browser being used or permissions the browser is allowing. Try using a different browser such as Chrome or Firefox. Please also make sure they are updated.
Deryck
I have tried the save version of Chrome on both computers with the same results (working on one computer but not the other). I have also tried edge on both with the same results.
Hello @bboozer,
If you open up the chrome developer tools do you see any errors in the console compared to the PC it works on?
Deryck
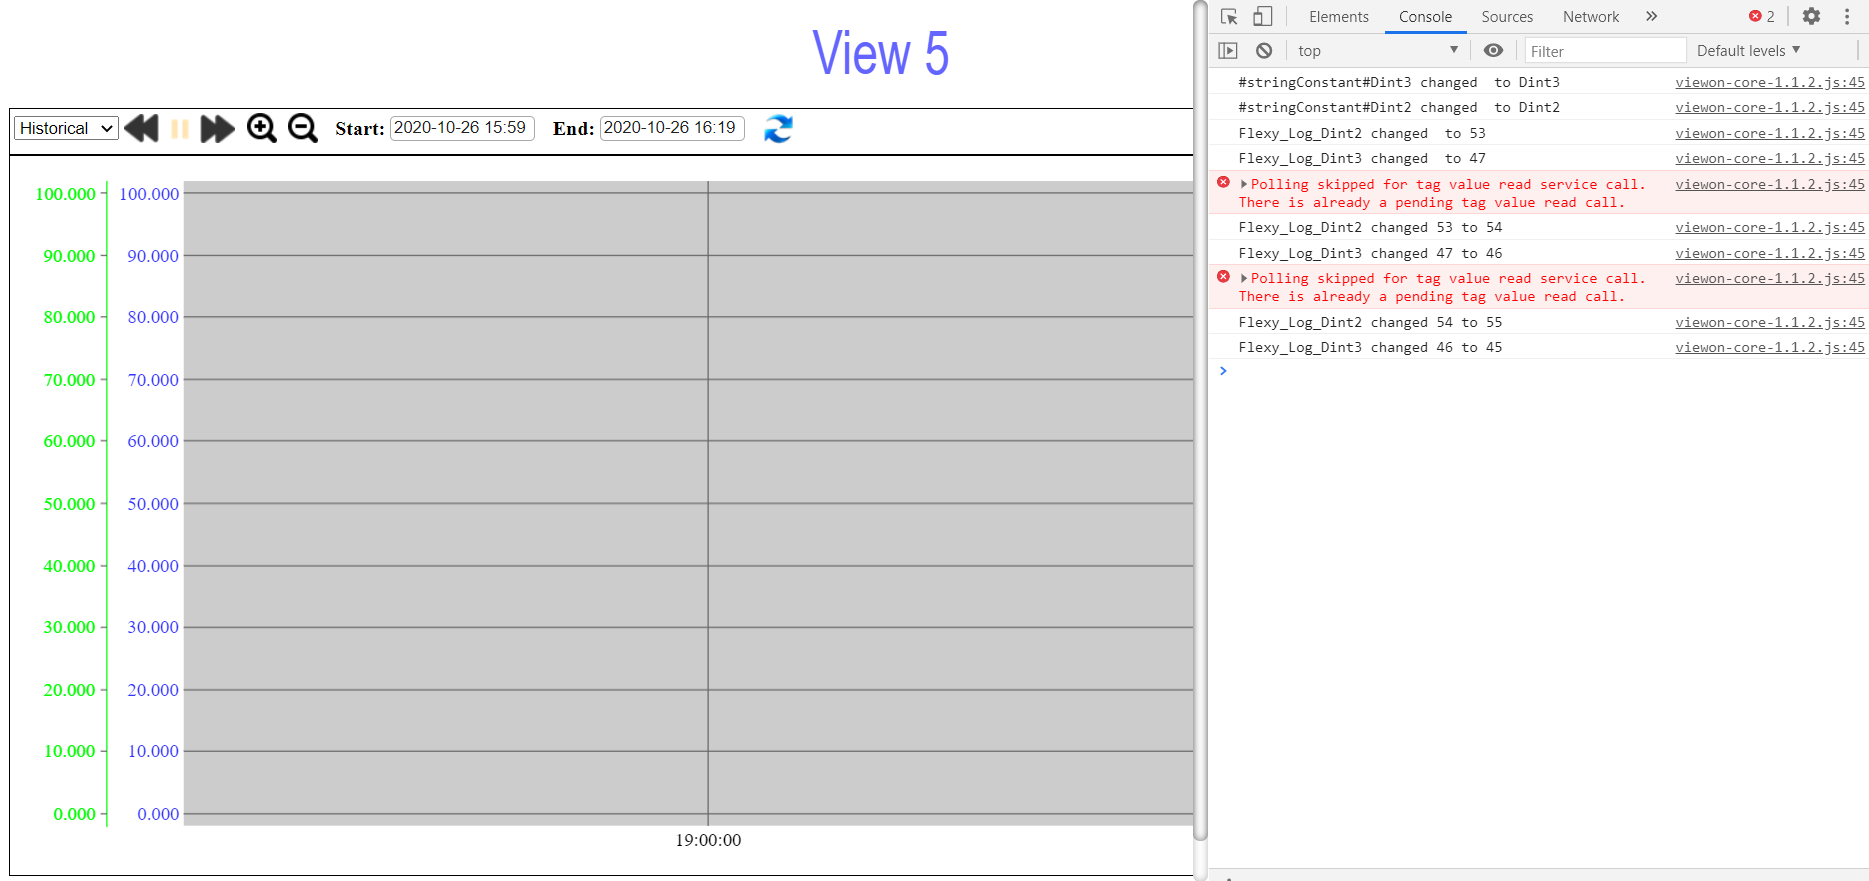
I loaded the page and left it for a couple of minutes and the only error I see (which occurs on both computers) is:
Polling skipped for tag value read service call. There is already a pending tag value read call.
Could you provide a screen shot showing both PC’s Views and this error?
Does it work on a third PC?
Or could you provide a temporary login for me to test the view myself?
Deryck
It does work on a third PC along with an IPad. I will check to see if I can setup a user for you to log in remotely.
Thanks
Hello @bboozer,
This might be difficult to track down if it is only happening on this one PC. The errors in the console do not look related to drawing the image.
This could be an issue with the time on the PC. It might be cause the data to be displayed incorrectly. Try changing the timer period being displayed in the graph and check the PC’s local time. Make sure the PC is setting its time via NTP.
Deryck
One of the PC’s that is working is actually a virtual machine running on the PC that is not working so they have the same time which is set via NTP. My assumption is that something on the computer is somehow blocking the historical part of the trend but not the real time functionality.
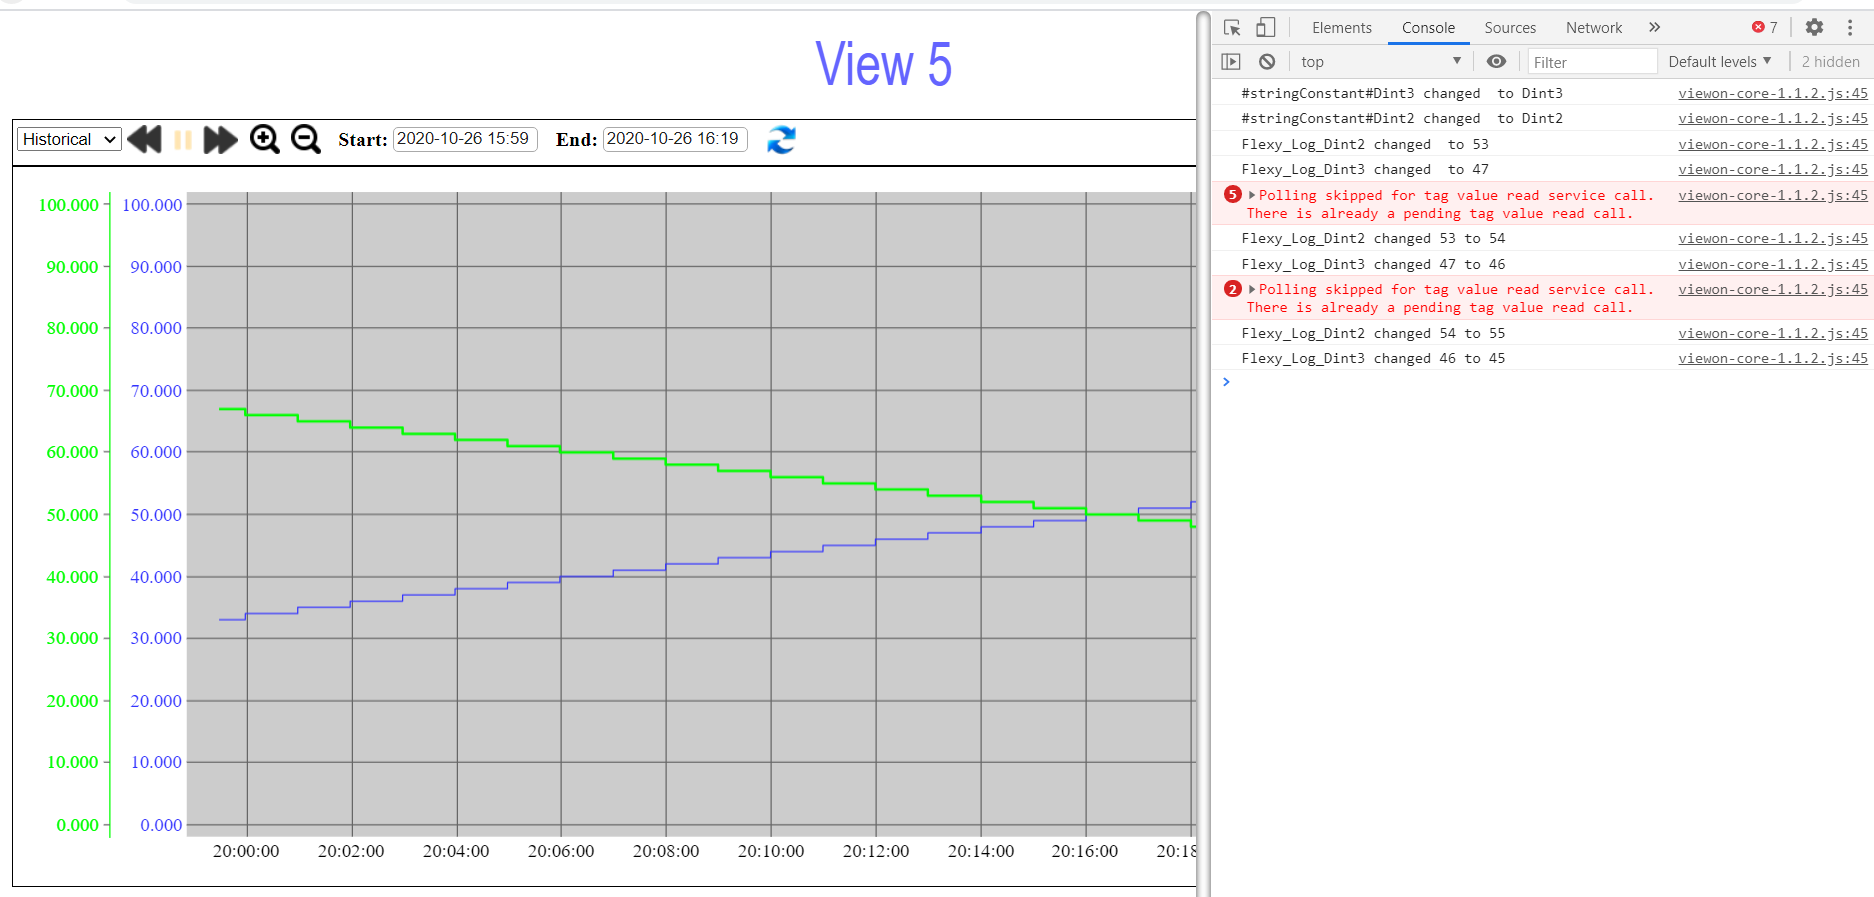
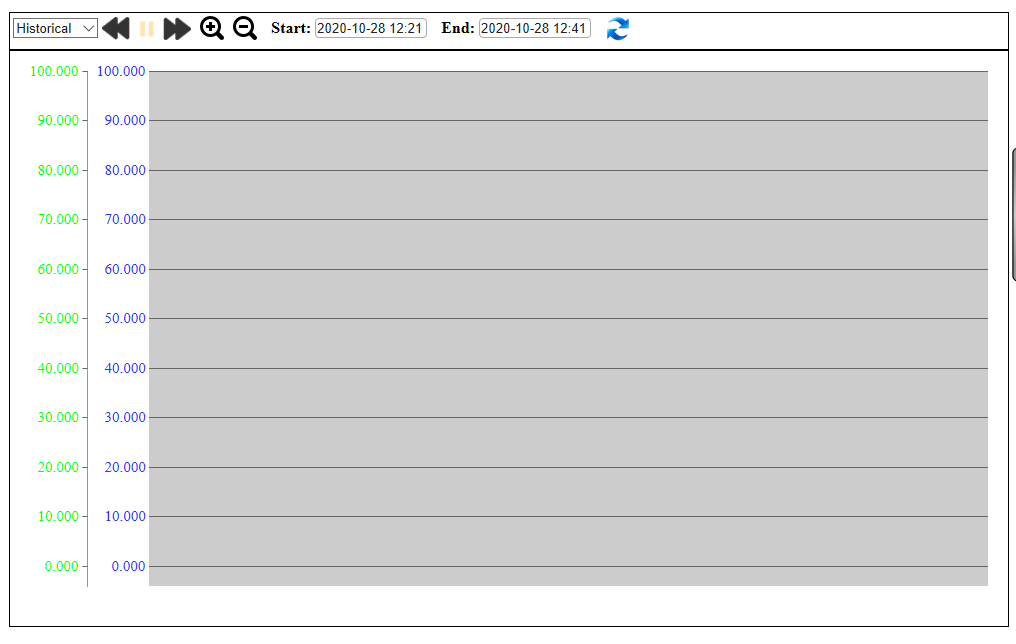
If you zoom out on the graph do you ever see any data? In the screen shot it looks like you are zoomed all the way into 19:00. In the one working you only show data just before 20:00.
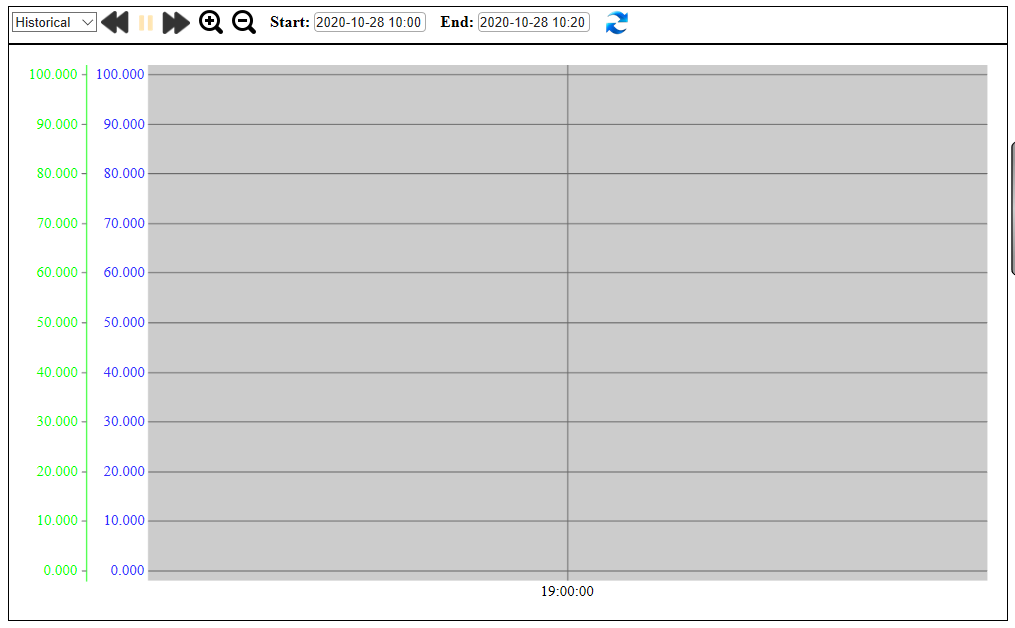
On the computer that doesn’t work it always shows the x axis at 19:00:00 no mater what the time range is set to. The zoom in and out buttons do not appear to function on the graph in this state. If you look at the time range set on the two attached graphs you see they are set to the same time but yet the one that is not working still shows 19:00:00 on the x axis.
Hello @bboozer ,
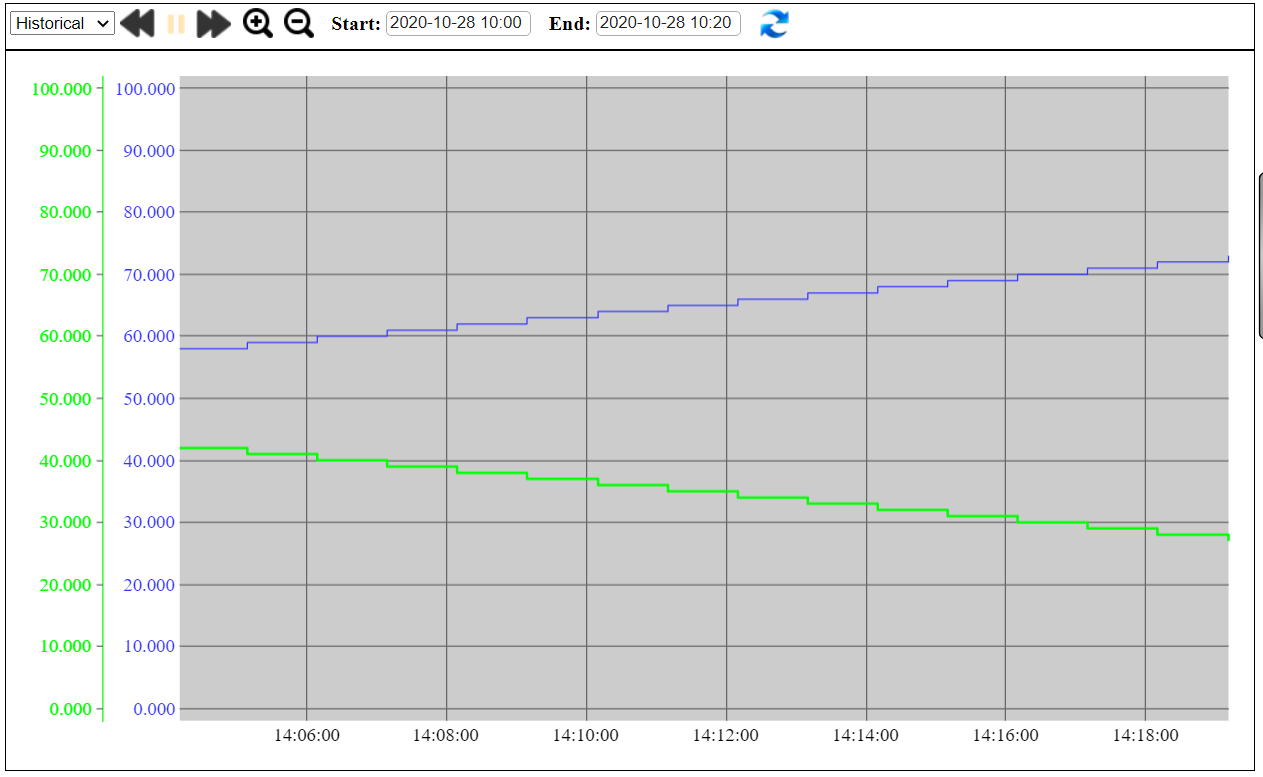
I think the issue here is that the graph is not showing you the set area of the graph with data. Are you able to use the arrows to move forward in time and see if you can find data.
Deryck
I tried that and the 19:00:00 disappears and after scrolling. Tried several time in both directions with same results.
Hello @bboozer,
It might be hard to resolve this since it seems unique to this pc. I can try taking a quick look over teamviewer if you can provide me with a TeamViewer ID and password.
Deryck